- Sign up to grade problem set 2
- Graphing in R
- 3 basic steps:
- Make list of x values
- Make a list of correspomding y values
- Use
plotfunction to draw graph (w/type=“l”)
- For example, plot x4 + 6 over -10 ≤ x ≤ 10
> x = seq( -10, 10, by=0.02 )
> y = x^4 + 6
> plot( x, y, type="l" )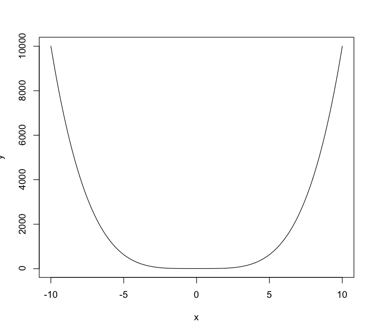
- (There is also a
curvefunction that is somewhat easier to use—typehelp( curve )in R for more information)
- 3 basic steps:
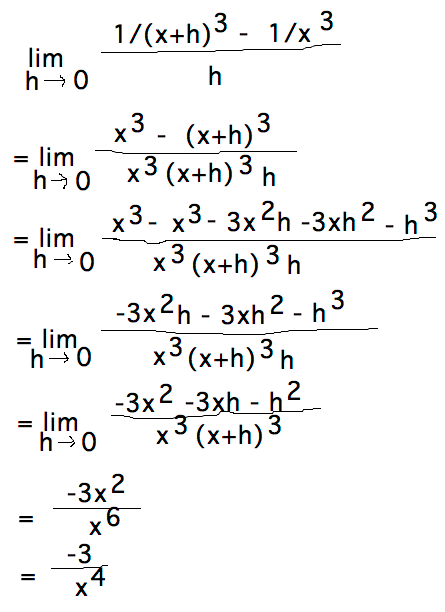
- f′(x) = limh→0( f(x+h) - f(x) ) / h
- f(x) = 1/x3
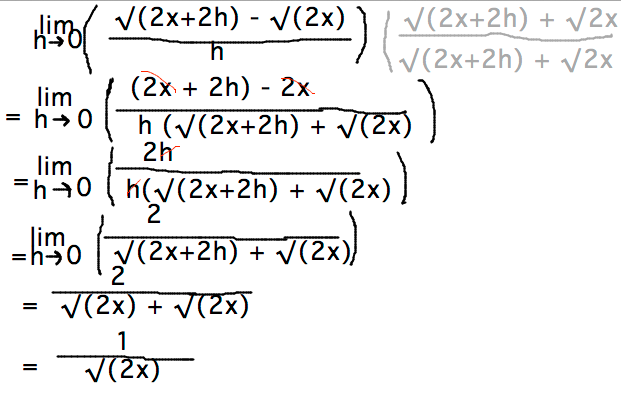
- f(x) = √(2x)
- Conjugate
- (√a - √b) (√a + √b) = (a - b)
- Apply to √(2x+2h) - √(2x)
- How would you do this with power rule?
- Needs chain rule too (so this is beyond what we’re doing so far)
- d/dx (2x)1/2
- = 1/2 (2x)-1/2 (2) power rule + chain rule
- = (2x)-1/2
- = 1 / √(2x)
- Conjugate
- Any examples you know of?
- if f(x) = k g(x) for any constant k, then f′(x) = k g′(x)
- if f(x) = xn then f′(x) = n xn-1
- if f(x) = g(x) h(x) then f′(x) = g′(x)h(x) + g(x)h′(x)
- if f(x) = g(x) / h(x) then f′(x) = ( g′(x)h(x) ) - (h′(x)g(x) ) / h2(x)
- if f(x) = g (h(x) ) then f′(x) = g′( h(x) ) h′(x)
- How does if f(x) = k g(x) for any constant k, then f′(x) = k g′(x)
follow from limit definition?
- f′(x) = limh→0( f(x+h) - f(x) ) / h
- = limh→0( kg(x+h) - kg(x) ) / h
- = limh→0 k ( g(x+h) - g(x) ) / h
- = k limh→0( g(x+h) - g(x) ) / h
- = k g′(x)
- “Powers, Multiples, Sums, and Differences” part of section 3.3
- Middle of page 118 - bottom of 121